require (readxl);require (data.table); require (ggplot2);library (ggpubr)
Loading required package: readxl
Loading required package: data.table
Loading required package: ggplot2
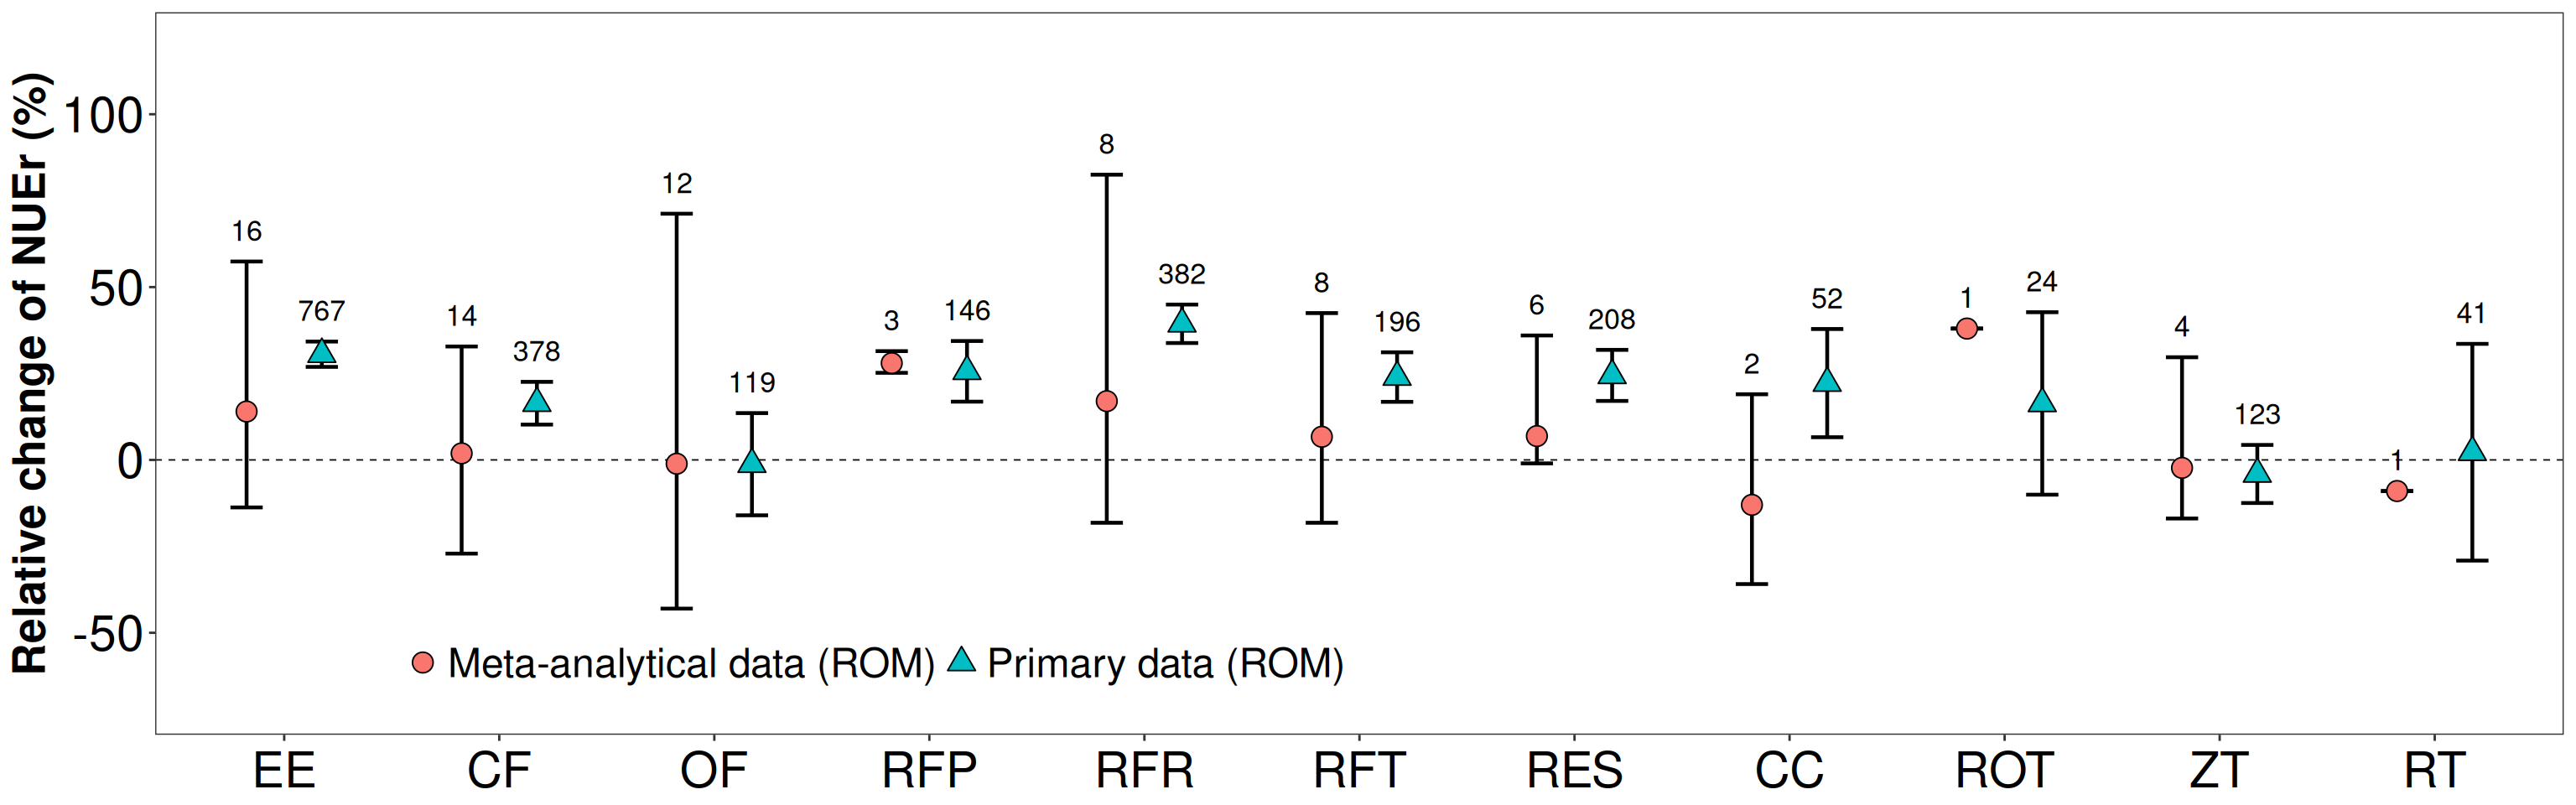
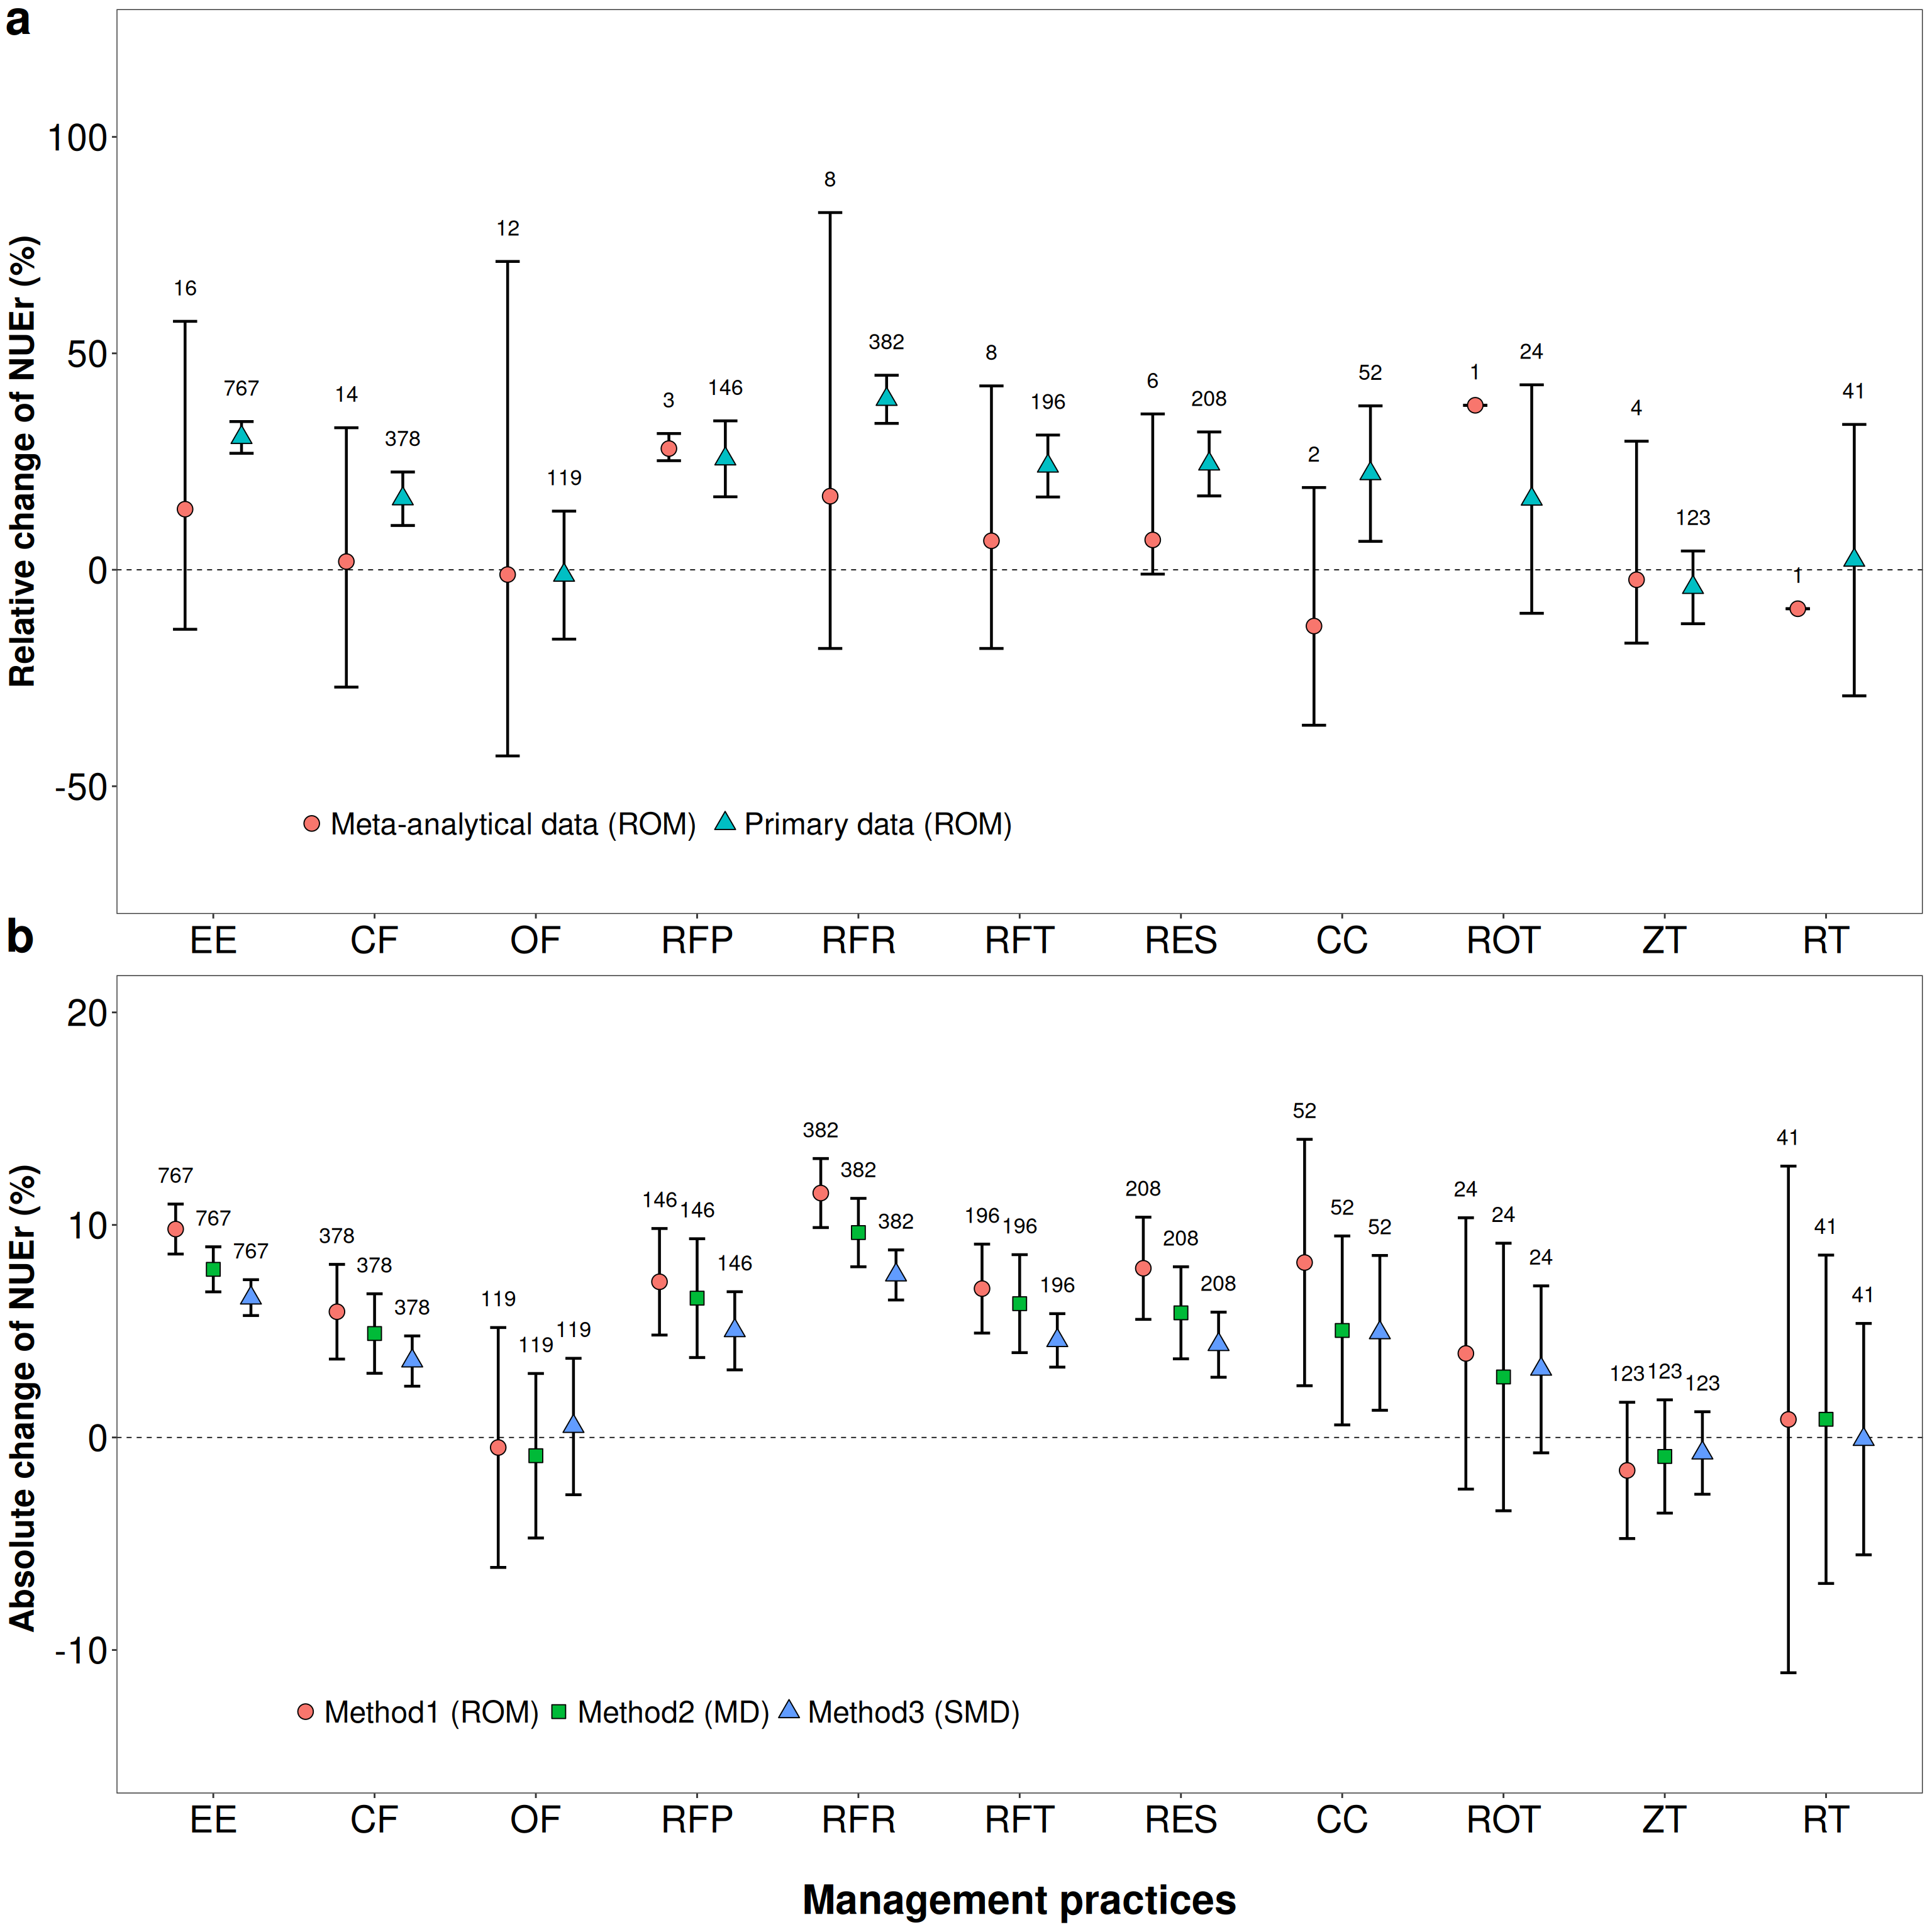
<- readxl:: read_xlsx ('Source Data.xlsx' ,sheet = "Figure2" )<- as.data.table (metaresult_group)# 数据集的子集 <- metaresult_group[Vari== 'NUE' & ` Group type ` == 'Data' ]<- ggplot (data = mydata,aes (x= Management,y= mean,shape= Group,fill= Group)) + geom_hline (yintercept= 0 ,linetype = "dashed" ,linewidth= 0.3 )+ geom_errorbar (position= position_dodge (0.7 ),aes (ymin = ci.lb, ymax = ci.ub), width= 0.3 ,size= 0.8 )+ geom_point (position= position_dodge (0.7 ), size= 4 , stroke = 0.5 ) + scale_shape_manual (values= c ("Meta-analytical data (ROM)" = 21 ,"Primary data (ROM)" = 24 ))+ geom_text (aes (x = Management, y = ci.ub + 6 , label = n),position = position_dodge (width = 0.7 ),vjust = 0 , hjust= 0.5 ,size = 4.5 , check_overlap = FALSE )+ scale_x_discrete (limits= rev (c ("Reduced tillage" ,"No tillage" ,"Crop rotation" ,"Cover cropping" ,"Residue retention" ,"Fertilizer timing" ,"Fertilizer rate" ,"Fertilizer placement" ,"Organic fertilizer" ,"Combined fertilizer" ,"Enhanced efficiency" )),labels = rev (c ("RT" ,"ZT" ,"ROT" ,"CC" ,"RES" ,"RFT" ,"RFR" ,"RFP" ,"OF" ,"CF" ,"EE" )))+ scale_y_continuous (limits= c (- 70 ,120 ), breaks = c (- 50 ,0 ,50 ,100 ))+ labs (x = "Management practice" , y = "Relative change of NUEr (%)" ,colour = 'black' )+ theme_bw ()+ theme (legend.title = element_blank (),legend.direction = "horizontal" ,legend.position= c (0.3 ,0.1 ),legend.key = element_rect (fill = "white" ,size = 1.5 ),legend.key.width = unit (0.4 ,"lines" ),legend.key.height = unit (0.5 ,"lines" ),legend.background = element_blank (),legend.text= element_text (colour = 'black' , size= 18 ),panel.grid.major = element_blank (),panel.grid.minor = element_blank (),axis.title= element_text (size= 20 , colour = 'black' , face= 'bold' ),axis.title.x= element_blank (),axis.text.y = element_text (colour = 'black' , size = 22 ),axis.text.x = element_text (colour = 'black' , size = 22 , hjust = 0.5 , vjust = 0.5 ))
Warning: Using `size` aesthetic for lines was deprecated in ggplot2 3.4.0.
ℹ Please use `linewidth` instead.
Warning: The `size` argument of `element_rect()` is deprecated as of ggplot2 3.4.0.
ℹ Please use the `linewidth` argument instead.
Warning: A numeric `legend.position` argument in `theme()` was deprecated in ggplot2
3.5.0.
ℹ Please use the `legend.position.inside` argument of `theme()` instead.
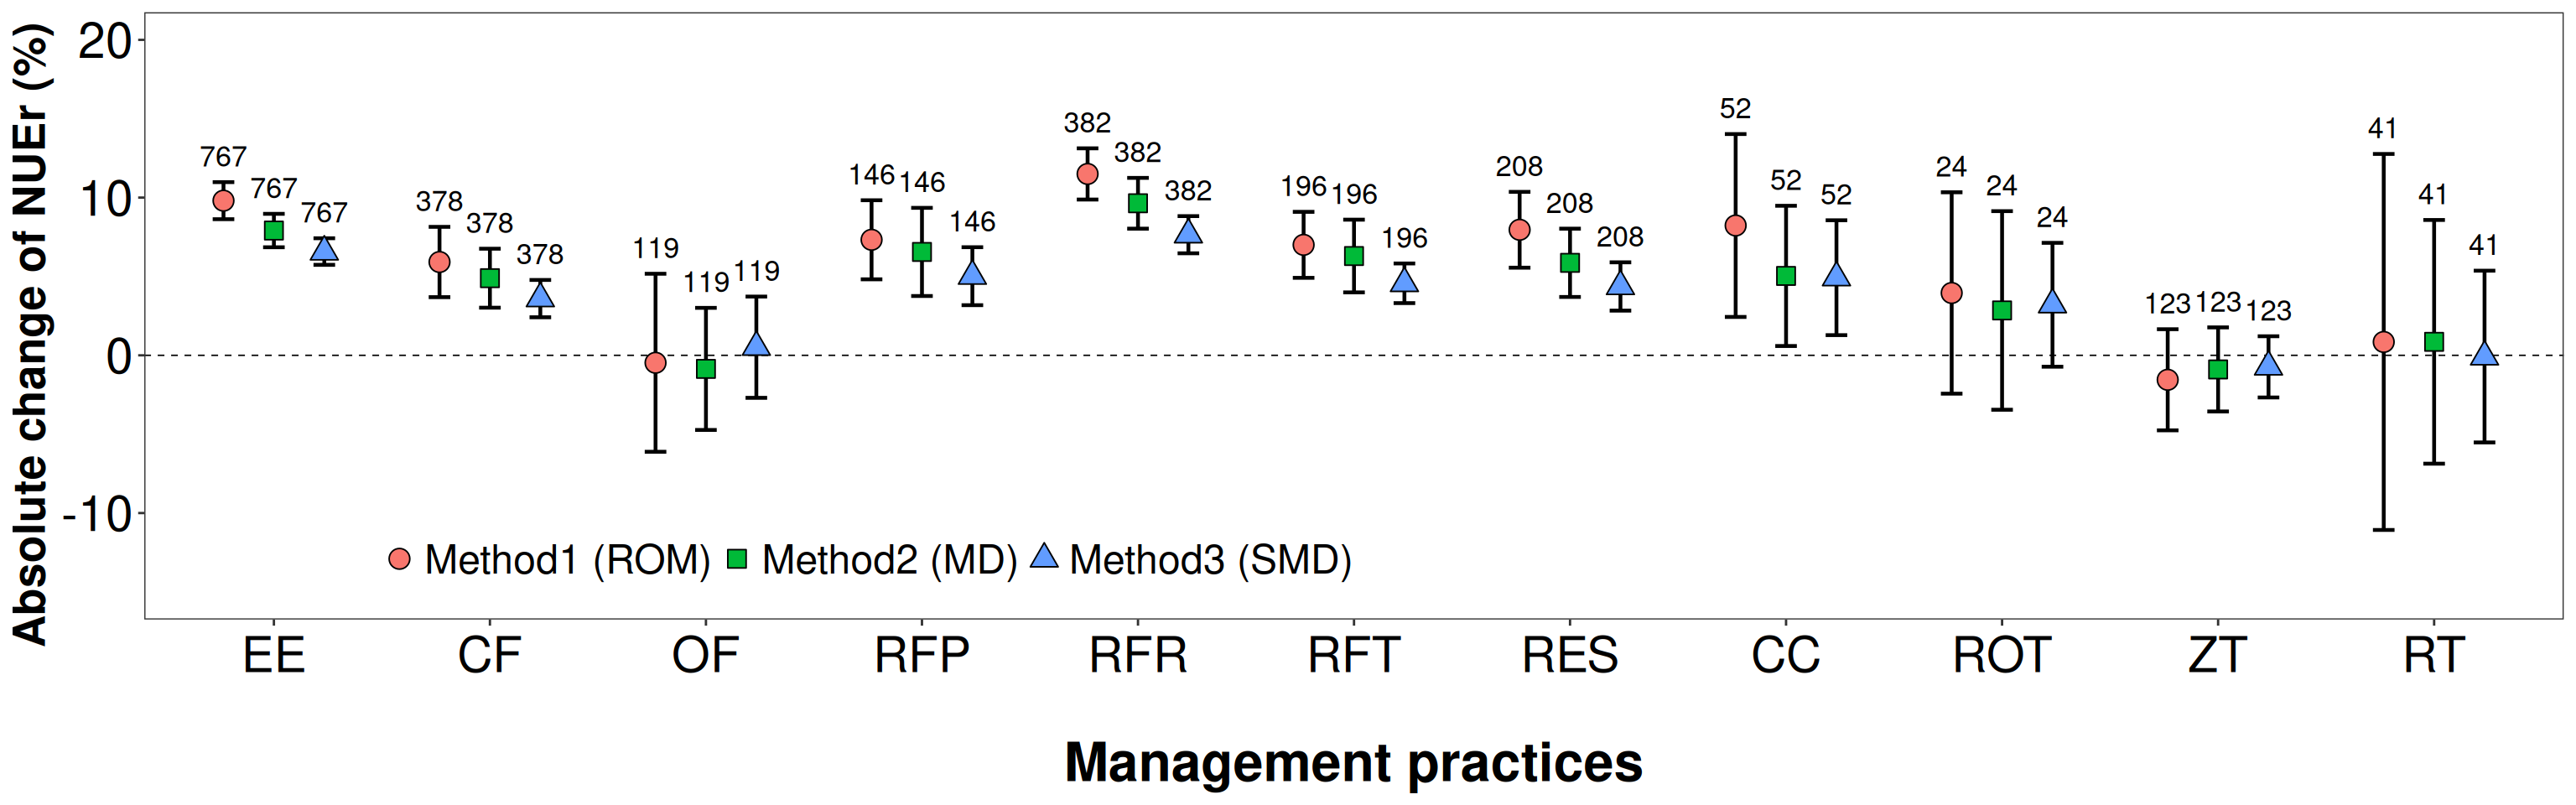
<- metaresult_group[Vari== 'NUE' & ` Group type ` == 'Method' ]<- ggplot (data = mydata,aes (x= Management,y= mean,shape= Group,fill= Group)) + geom_hline (yintercept= 0 ,linetype = "dashed" ,linewidth= 0.3 )+ geom_errorbar (position= position_dodge (0.7 ),aes (ymin = ci.lb, ymax = ci.ub), width= 0.3 ,size= 0.8 )+ geom_point (position= position_dodge (0.7 ), size= 4 , stroke = 0.5 ) + scale_shape_manual (values= c ("Method1 (ROM)" = 21 , "Method2 (MD)" = 22 , "Method3 (SMD)" = 24 ))+ geom_text (aes (x = Management, y = ci.ub + 1 , label = n),position = position_dodge (width = 0.7 ),vjust = 0 ,hjust= 0.5 , size = 4.5 , check_overlap = FALSE )+ scale_x_discrete (limits= rev (c ("Reduced tillage" ,"No tillage" ,"Crop rotation" ,"Cover cropping" ,"Residue retention" ,"Fertilizer timing" ,"Fertilizer rate" ,"Fertilizer placement" ,"Organic fertilizer" ,"Combined fertilizer" ,"Enhanced efficiency" )),labels = rev (c ("RT" ,"ZT" ,"ROT" ,"CC" ,"RES" ,"RFT" ,"RFR" ,"RFP" ,"OF" ,"CF" ,"EE" )))+ scale_y_continuous (limits= c (- 15 ,20 ), breaks = c (- 10 ,0 ,10 ,20 ))+ labs (x = " \n Management practices" , y = "Absolute change of NUEr (%) " ,colour = 'black' )+ theme_bw ()+ theme (legend.title = element_blank (),legend.direction = "horizontal" ,legend.position= c (0.3 ,0.1 ),legend.key = element_rect (fill = "white" ,size = 1.5 ),legend.key.width = unit (0.4 ,"lines" ),legend.key.height = unit (0.5 ,"lines" ),legend.background = element_blank (),legend.text= element_text (colour = 'black' , size= 18 ),panel.grid.major = element_blank (),panel.grid.minor = element_blank (),axis.title.x= element_text (size= 24 , colour = 'black' , face= 'bold' ),axis.title.y= element_text (size= 20 , colour = 'black' , face= 'bold' ),#axis.title.x=element_blank(), axis.text.y = element_text (colour = 'black' , size = 22 ),axis.text.x = element_text (colour = 'black' , size = 22 , hjust = 0.5 , vjust = 0.5 ))