Loading required package: ggplot2
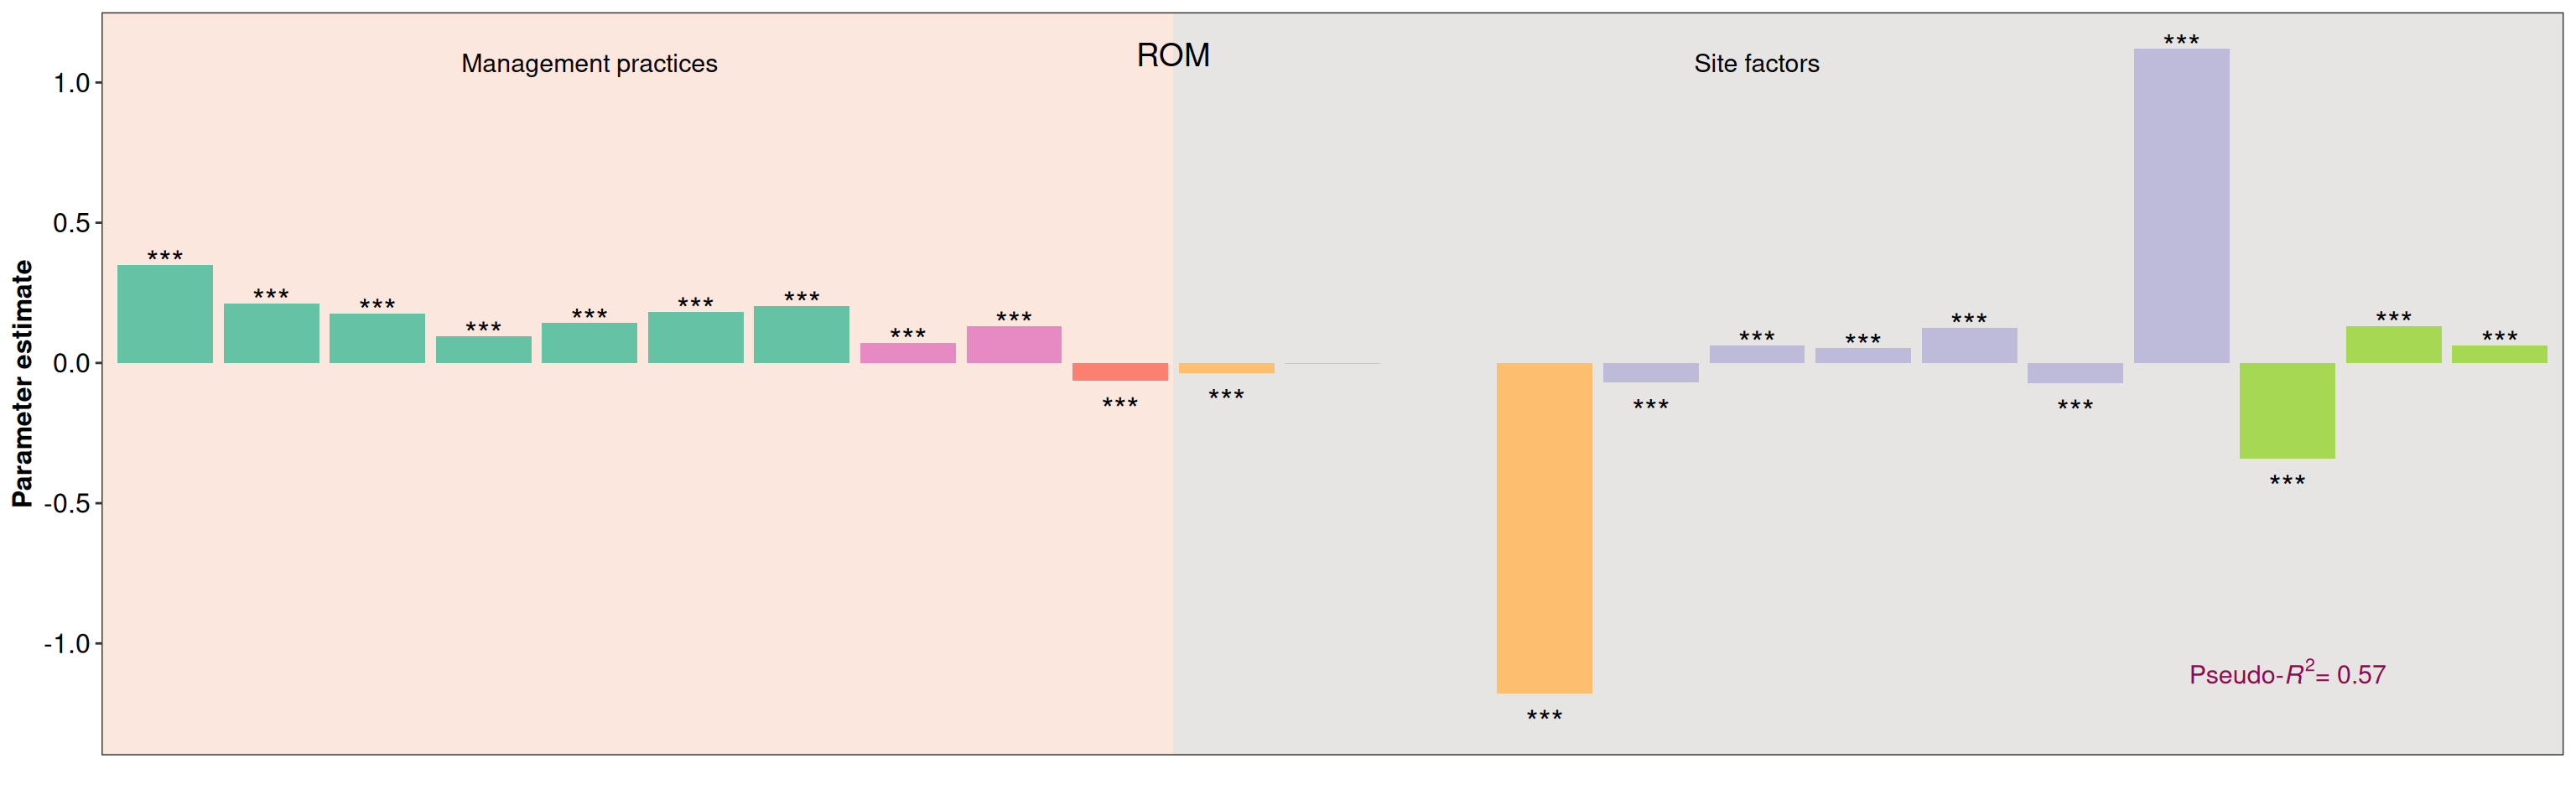
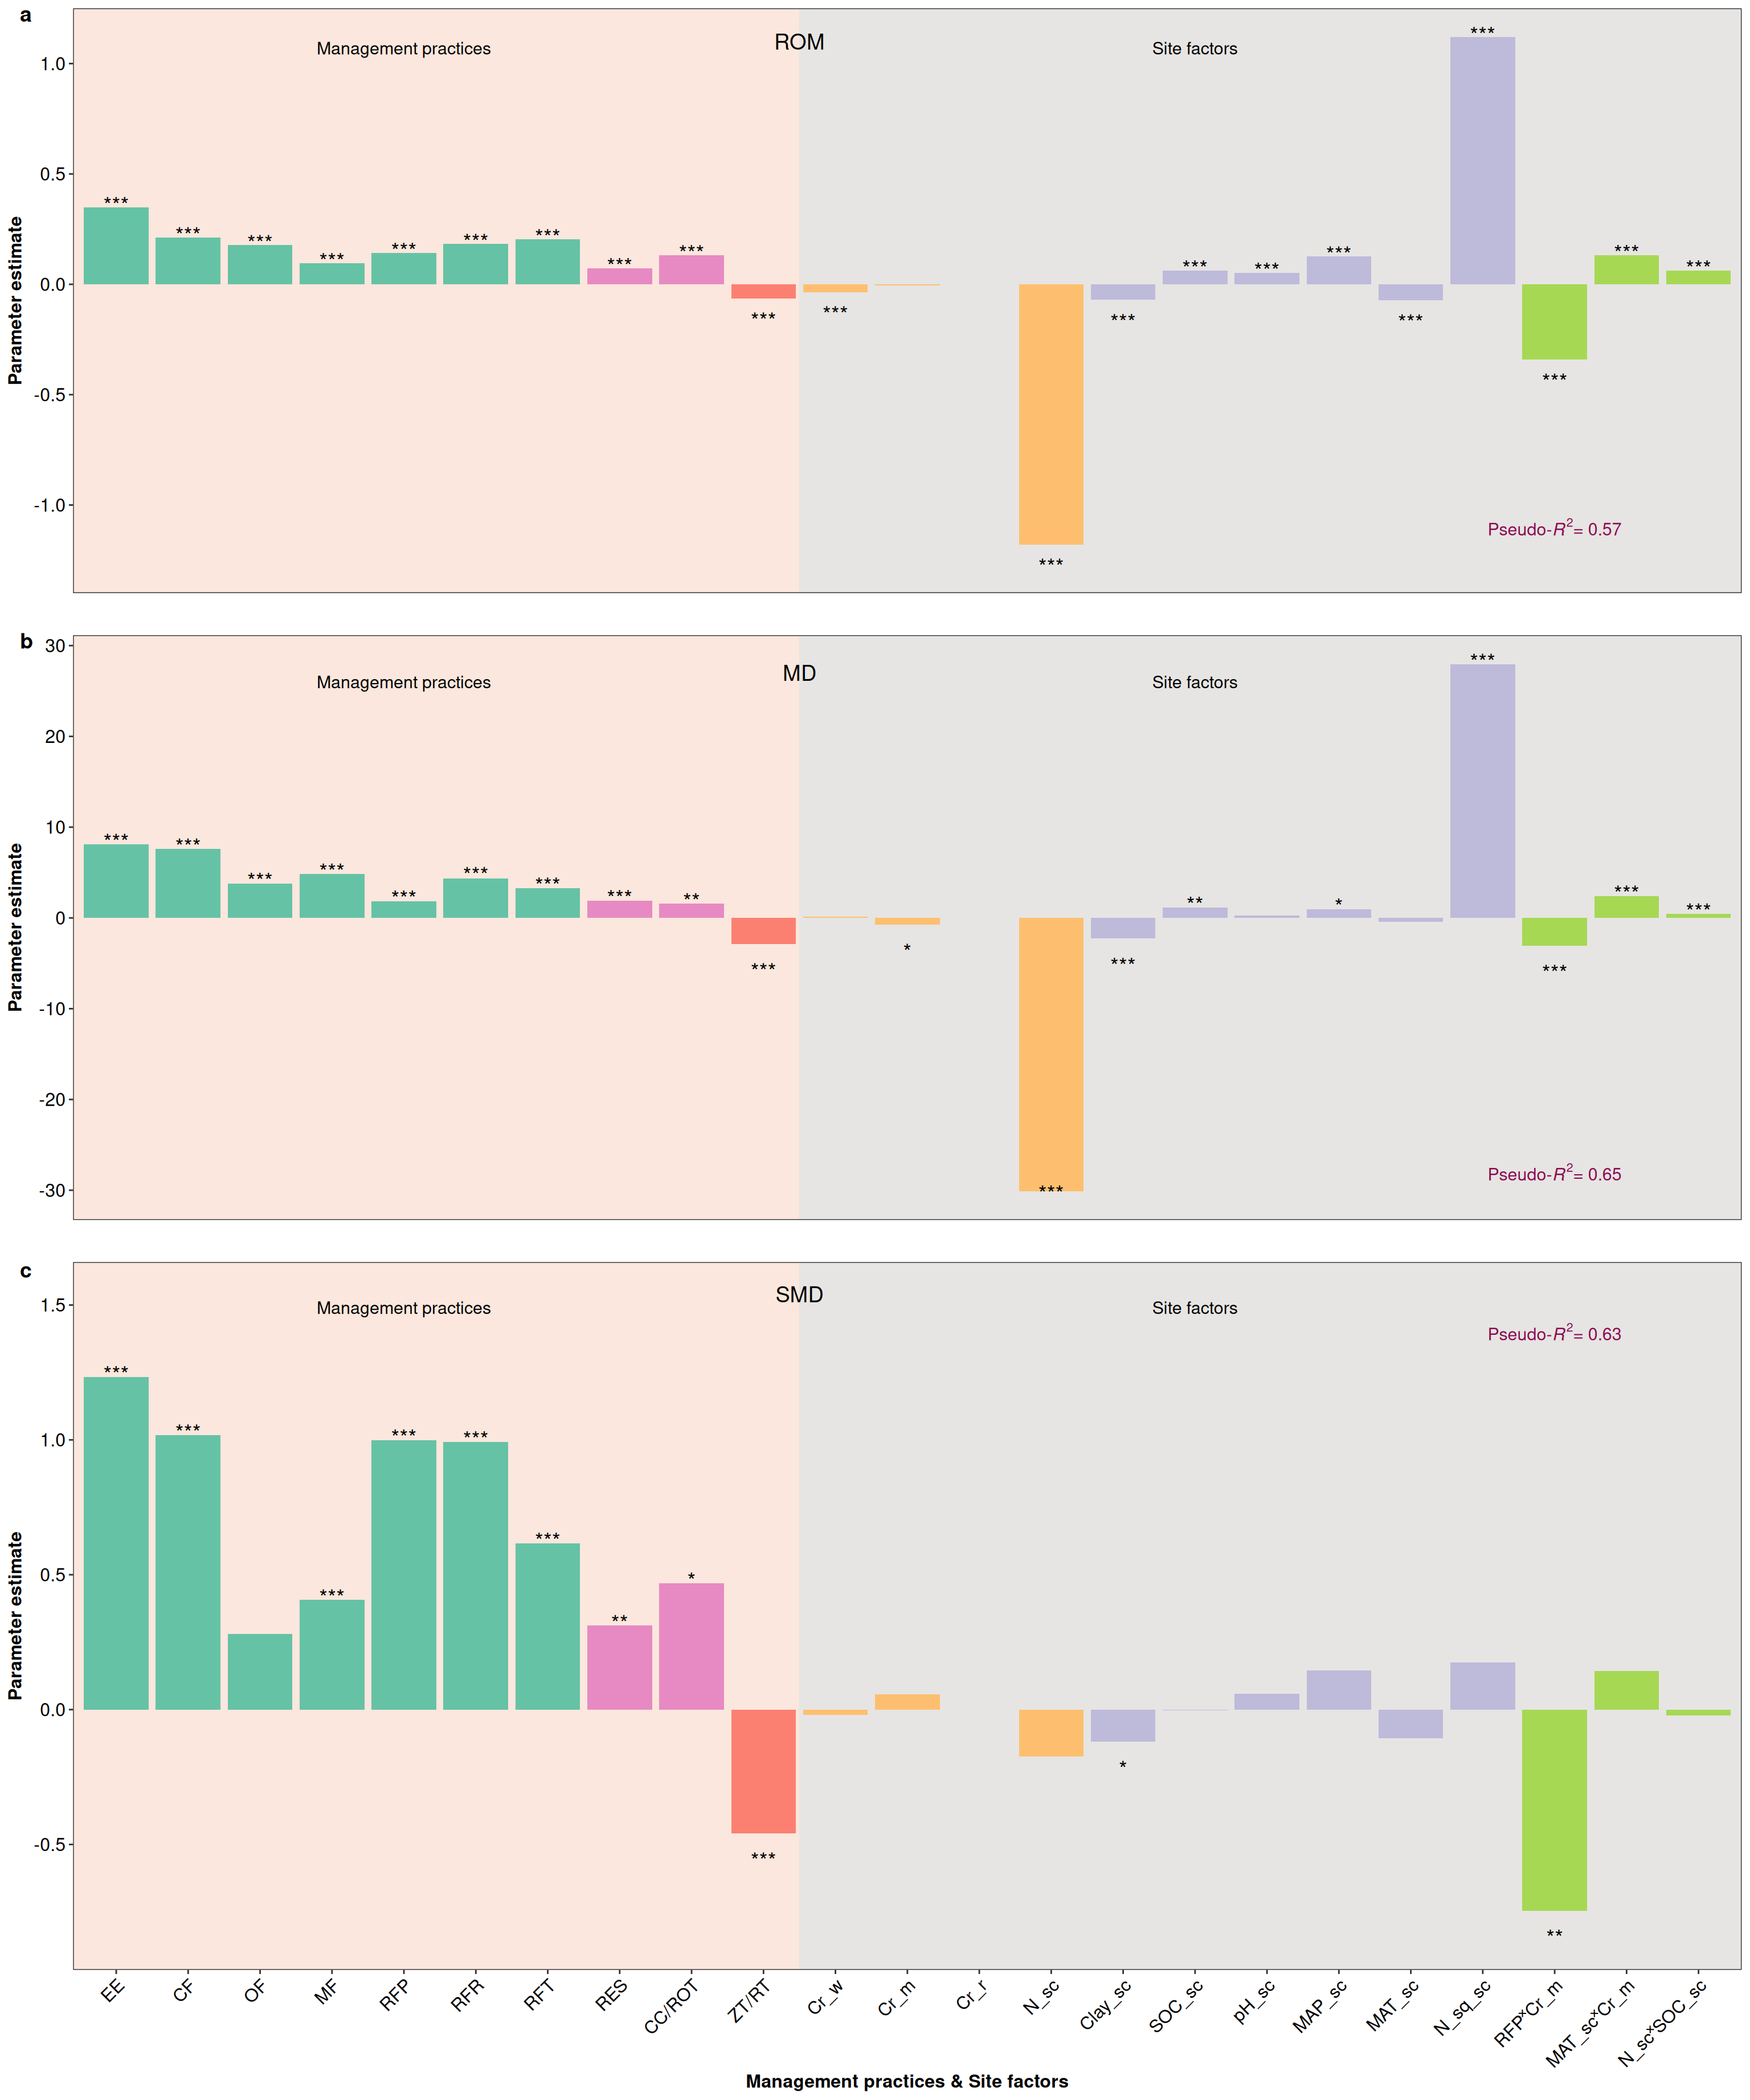
library (data.table)# --- ROM Method ----- <- readxl:: read_xlsx ('Source Data.xlsx' ,sheet = "Figure3a" )<- as.data.table (d1)$ Moderator1 <- factor (d1$ Moderator1, levels = c ("EE" ,"CF" ,"OF" ,"MF" ,"RFP" ,"RFR" ,"RFT" ,"RES" ,"CC/ROT" ,"ZT/RT" ,"Cr_w" ,"Cr_m" ,"Cr_r" ,"N_sc" ,"Clay_sc" ,"SOC_sc" ,"pH_sc" ,"MAP_sc" ,"MAT_sc" ,"N_sq_sc" ,"RFP˟Cr_m" ,"MAT_sc˟Cr_m" ,"N_sc˟SOC_sc" ))<- ggplot (d1,aes (Moderator1,Parameter_estimate))+ geom_col ()+ theme_bw ()+ #Remove shadow theme (panel.grid= element_blank ())+ #Remove grid lines geom_rect (aes (ymin = - Inf , xmin = - Inf , ymax = Inf , xmax = 10.5 ), fill = "#FBE7DD" )+ #Fill background color geom_rect (aes (ymin = - Inf , xmin = 10.5 , ymax = Inf , xmax = Inf ), fill = "#E6E5E3" )+ #Fill background color geom_col (fill = c ("#66c2a5" , "#66c2a5" , "#66c2a5" ,"#66c2a5" , "#66c2a5" , "#66c2a5" ,"#66c2a5" , "#e78ac3" ,"#e78ac3" ,"#fb8072" , "#fdbf6f" ,"#fdbf6f" , "#fdbf6f" , "#fdbf6f" ,"#bebada" ,"#bebada" ,"#bebada" ,"#bebada" ,"#bebada" ,"#bebada" ,"#a6d854" ,"#a6d854" , "#a6d854" ))+ #Custom color xlab ("" )+ ylab ("Parameter estimate" )+ #ylim(-0.15,0.5)+ theme (legend.position = "none" ,axis.title = element_text (size= 12 , colour= "black" , face = "bold" ),axis.text.x = element_blank (),axis.ticks.x= element_blank (),axis.text.y = element_text (size= 12 , colour= "black" ))+ annotate ("text" ,x= 1 ,y= 0.3595 ,label= "***" ,size= 5 )+ annotate ("text" ,x= 2 ,y= 0.2229 ,label= "***" ,size= 5 )+ annotate ("text" ,x= 3 ,y= 0.1871 ,label= "***" ,size= 5 )+ annotate ("text" ,x= 4 ,y= 0.1056 ,label= "***" ,size= 5 )+ annotate ("text" ,x= 5 ,y= 0.1519 ,label= "***" ,size= 5 )+ annotate ("text" ,x= 6 ,y= 0.1927 ,label= "***" ,size= 5 )+ annotate ("text" ,x= 7 ,y= 0.2136 ,label= "***" ,size= 5 )+ annotate ("text" ,x= 8 ,y= 0.0825 ,label= "***" ,size= 5 )+ annotate ("text" ,x= 9 ,y= 0.1417 ,label= "***" ,size= 5 )+ annotate ("text" ,x= 10 ,y= - 0.1638 ,label= "***" ,size= 5 )+ annotate ("text" ,x= 11 ,y= - 0.1353 ,label= "***" ,size= 5 )+ annotate ("text" ,x= 12 ,y= 0.1006 ,label= "" ,size= 5 )+ annotate ("text" ,x= 13 ,y= 0.01 ,label= "" ,size= 5 )+ annotate ("text" ,x= 14 ,y= - 1.2786 ,label= "***" ,size= 5 )+ annotate ("text" ,x= 15 ,y= - 0.1706 ,label= "***" ,size= 5 )+ annotate ("text" ,x= 16 ,y= 0.0726 ,label= "***" ,size= 5 )+ annotate ("text" ,x= 17 ,y= 0.0622 ,label= "***" ,size= 5 )+ annotate ("text" ,x= 18 ,y= 0.1359 ,label= "***" ,size= 5 )+ annotate ("text" ,x= 19 ,y= - 0.1723 ,label= "***" ,size= 5 )+ annotate ("text" ,x= 20 ,y= 1.13 ,label= "***" ,size= 5 )+ annotate ("text" ,x= 21 ,y= - 0.4404 ,label= "***" ,size= 5 )+ annotate ("text" ,x= 22 ,y= 0.1422 ,label= "***" ,size= 5 )+ annotate ("text" ,x= 23 ,y= 0.0727 ,label= "***" ,size= 5 )+ annotate ("text" ,x= 10.5 ,y= 1.1 ,label= "ROM" ,size= 5 , face = "bold" , colour= "black" )+ annotate ("text" ,x= 5 ,y= 1.07 ,label= "Management practices" ,size= 4 , face = "bold" , colour= "black" )+ annotate ("text" ,x= 16 ,y= 1.07 ,label= "Site factors" ,size= 4 , face = "bold" , colour= "black" )+ annotate ("text" ,x= 21 ,y= - 1.1 ,label= expression (paste ("Pseudo-" ,italic (R^ 2 ),"= 0.57" )), size= 4 , face = "bold" , colour= "deeppink4" )
Warning in annotate("text", x = 10.5, y = 1.1, label = "ROM", size = 5, :
Ignoring unknown parameters: `face`
Warning in annotate("text", x = 5, y = 1.07, label = "Management practices", :
Ignoring unknown parameters: `face`
Warning in annotate("text", x = 16, y = 1.07, label = "Site factors", size = 4,
: Ignoring unknown parameters: `face`
Warning in annotate("text", x = 21, y = -1.1, label =
expression(paste("Pseudo-", : Ignoring unknown parameters: `face`
Warning in is.na(x): is.na() applied to non-(list or vector) of type
'expression'
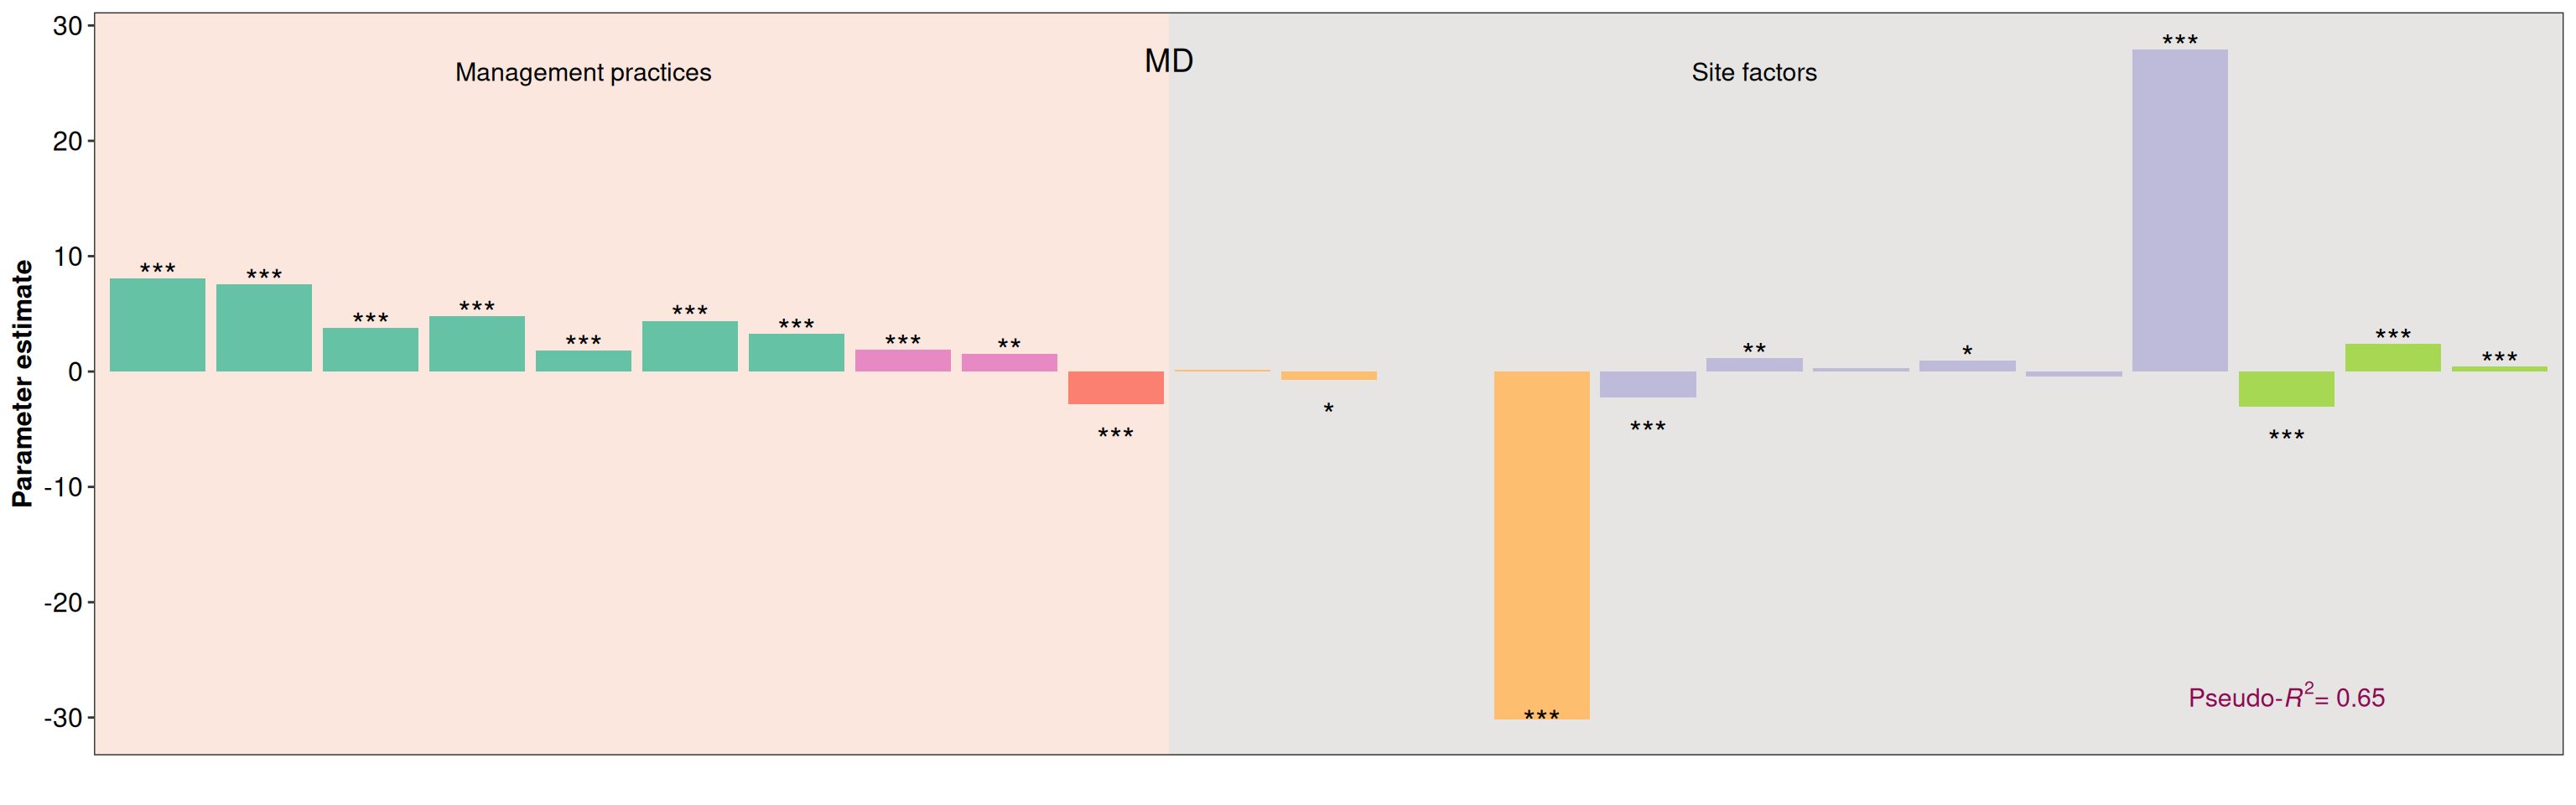
# --- MD Method ---- <- readxl:: read_xlsx ('Source Data.xlsx' ,sheet = "Figure3b" )<- as.data.table (d2)$ Moderator1 <- factor (d2$ Moderator1, levels = c ("EE" ,"CF" ,"OF" ,"MF" ,"RFP" ,"RFR" ,"RFT" ,"RES" ,"CC/ROT" ,"ZT/RT" ,"Cr_w" ,"Cr_m" ,"Cr_r" ,"N_sc" ,"Clay_sc" ,"SOC_sc" ,"pH_sc" ,"MAP_sc" ,"MAT_sc" ,"N_sq_sc" ,"RFP˟Cr_m" ,"MAT_sc˟Cr_m" ,"N_sc˟SOC_sc" ))<- ggplot (d2,aes (Moderator1, Parameter_estimate))+ geom_col ()+ theme_bw ()+ theme (panel.grid= element_blank ())+ geom_rect (aes (ymin = - Inf , xmin = - Inf , ymax = Inf , xmax = 10.5 ), fill = "#FBE7DD" )+ geom_rect (aes (ymin = - Inf , xmin = 10.5 , ymax = Inf , xmax = Inf ), fill = "#E6E5E3" )+ geom_col (fill = c ("#66c2a5" , "#66c2a5" , "#66c2a5" ,"#66c2a5" , "#66c2a5" , "#66c2a5" ,"#66c2a5" , "#e78ac3" ,"#e78ac3" ,"#fb8072" , "#fdbf6f" ,"#fdbf6f" , "#fdbf6f" , "#fdbf6f" ,"#bebada" ,"#bebada" ,"#bebada" ,"#bebada" ,"#bebada" ,"#bebada" ,"#a6d854" ,"#a6d854" , "#a6d854" ))+ xlab ("" )+ ylab ("Parameter estimate" )+ theme (legend.position = "none" , axis.title = element_text (size= 12 , colour= "black" , face = "bold" ),axis.text.x = element_blank (),axis.ticks.x= element_blank (),axis.text.y = element_text (size= 12 , colour= "black" ))+ annotate ("text" ,x= 1 ,y= 8.3954 ,label= "***" ,size= 5 )+ annotate ("text" ,x= 2 ,y= 7.8767 ,label= "***" ,size= 5 )+ annotate ("text" ,x= 3 ,y= 4.0867 ,label= "***" ,size= 5 )+ annotate ("text" ,x= 4 ,y= 5.115 ,label= "***" ,size= 5 )+ annotate ("text" ,x= 5 ,y= 2.1479 ,label= "***" ,size= 5 )+ annotate ("text" ,x= 6 ,y= 4.7411 ,label= "***" ,size= 5 )+ annotate ("text" ,x= 7 ,y= 3.5728 ,label= "***" ,size= 5 )+ annotate ("text" ,x= 8 ,y= 2.193 ,label= "***" ,size= 5 )+ annotate ("text" ,x= 9 ,y= 1.8543 ,label= "**" ,size= 5 )+ annotate ("text" ,x= 10 ,y= - 5.8625 ,label= "***" ,size= 5 )+ annotate ("text" ,x= 11 ,y= - 5.1326 ,label= "" ,size= 5 )+ annotate ("text" ,x= 12 ,y= - 3.7213 ,label= "*" ,size= 5 )+ annotate ("text" ,x= 13 ,y= 0.1 ,label= "" ,size= 5 )+ annotate ("text" ,x= 14 ,y= - 30.3474 ,label= "***" ,size= 5 )+ annotate ("text" ,x= 15 ,y= - 5.2753 ,label= "***" ,size= 5 )+ annotate ("text" ,x= 16 ,y= 1.4541 ,label= "**" ,size= 5 )+ annotate ("text" ,x= 17 ,y= 0.5732 ,label= "" ,size= 5 )+ annotate ("text" ,x= 18 ,y= 1.2656 ,label= "*" ,size= 5 )+ annotate ("text" ,x= 19 ,y= 0.5312 ,label= "" ,size= 5 )+ annotate ("text" ,x= 20 ,y= 28.22 ,label= "***" ,size= 5 )+ annotate ("text" ,x= 21 ,y= - 6.0466 ,label= "***" ,size= 5 )+ annotate ("text" ,x= 22 ,y= 2.6939 ,label= "***" ,size= 5 )+ annotate ("text" ,x= 23 ,y= 0.7221 ,label= "***" ,size= 5 )+ annotate ("text" ,x= 10.5 ,y= 27 ,label= "MD" ,size= 5 , face = "bold" , colour= "black" )+ annotate ("text" ,x= 5 ,y= 26 ,label= "Management practices" ,size= 4 , face = "bold" , colour= "black" )+ annotate ("text" ,x= 16 ,y= 26 ,label= "Site factors" ,size= 4 , face = "bold" , colour= "black" )+ annotate ("text" ,x= 21 ,y= - 28 ,label= expression (paste ("Pseudo-" ,italic (R^ 2 ),"= 0.65" )), size= 4 , face = "bold" , colour= "deeppink4" )
Warning in annotate("text", x = 10.5, y = 27, label = "MD", size = 5, face =
"bold", : Ignoring unknown parameters: `face`
Warning in annotate("text", x = 5, y = 26, label = "Management practices", :
Ignoring unknown parameters: `face`
Warning in annotate("text", x = 16, y = 26, label = "Site factors", size = 4, :
Ignoring unknown parameters: `face`
Warning in annotate("text", x = 21, y = -28, label =
expression(paste("Pseudo-", : Ignoring unknown parameters: `face`
Warning in is.na(x): is.na() applied to non-(list or vector) of type
'expression'
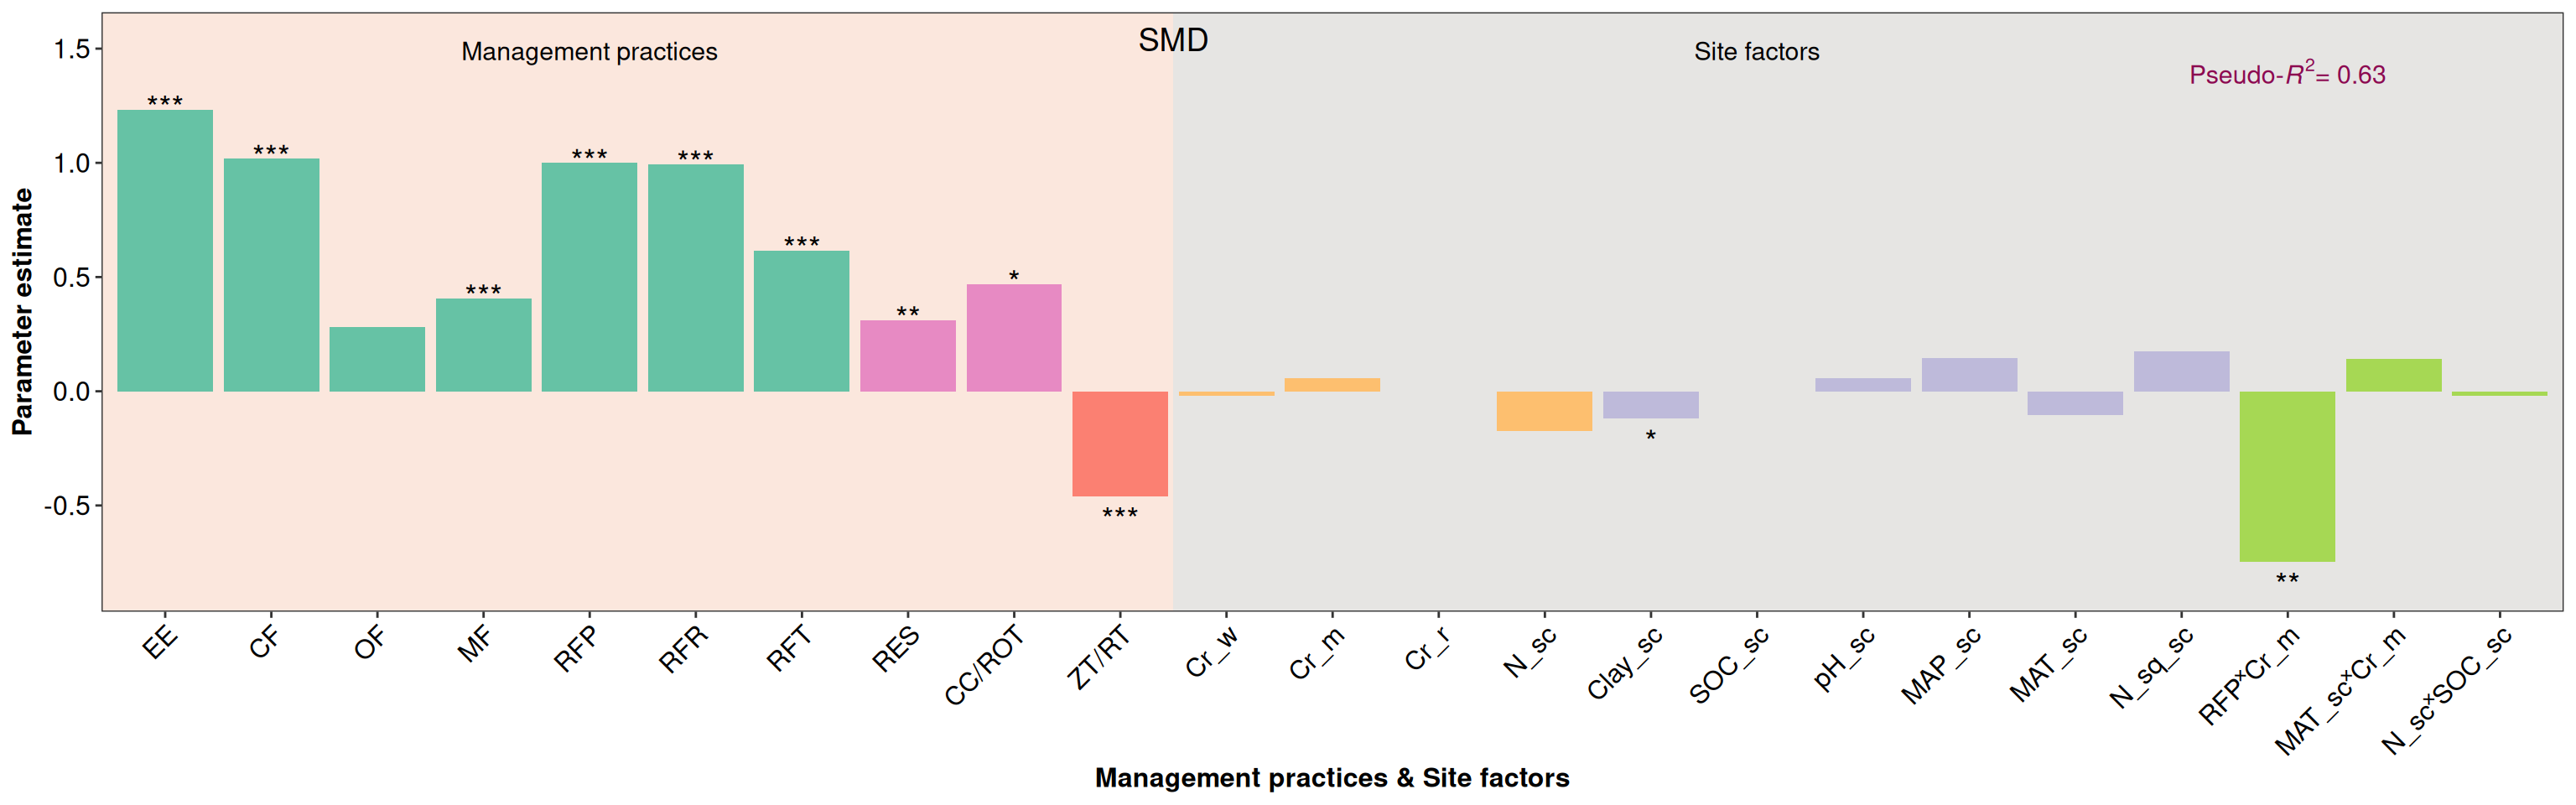
# --- SMD Method ----- <- readxl:: read_xlsx ('Source Data.xlsx' ,sheet = "Figure3c" )<- as.data.table (d3)$ Moderator1 <- factor (d2$ Moderator1, levels = c ("EE" ,"CF" ,"OF" ,"MF" ,"RFP" ,"RFR" ,"RFT" ,"RES" ,"CC/ROT" ,"ZT/RT" ,"Cr_w" ,"Cr_m" ,"Cr_r" ,"N_sc" ,"Clay_sc" ,"SOC_sc" ,"pH_sc" ,"MAP_sc" ,"MAT_sc" ,"N_sq_sc" ,"RFP˟Cr_m" ,"MAT_sc˟Cr_m" ,"N_sc˟SOC_sc" ))<- ggplot (d3,aes (Moderator1,Parameter_estimate))+ geom_col ()+ theme_bw ()+ theme (panel.grid= element_blank ())+ geom_rect (aes (ymin = - Inf , xmin = - Inf , ymax = Inf , xmax = 10.5 ), fill = "#FBE7DD" )+ geom_rect (aes (ymin = - Inf , xmin = 10.5 , ymax = Inf , xmax = Inf ), fill = "#E6E5E3" )+ geom_col (fill = c ("#66c2a5" , "#66c2a5" , "#66c2a5" ,"#66c2a5" , "#66c2a5" , "#66c2a5" ,"#66c2a5" , "#e78ac3" ,"#e78ac3" , "#fb8072" , "#fdbf6f" ,"#fdbf6f" , "#fdbf6f" , "#fdbf6f" ,"#bebada" ,"#bebada" ,"#bebada" ,"#bebada" ,"#bebada" ,"#bebada" ,"#a6d854" ,"#a6d854" , "#a6d854" ))+ xlab ("Management practices & Site factors" )+ ylab ("Parameter estimate" )+ theme (legend.position = "none" ,axis.title = element_text (size= 12 , face = "bold" , colour= "black" ),axis.text.x = element_text (size= 12 ,angle = 45 , hjust = 1 , vjust = 1 , colour= "black" ),axis.text.y = element_text (size= 12 , colour= "black" ))+ annotate ("text" ,x= 1 ,y= 1.2434 ,label= "***" ,size= 5 )+ annotate ("text" ,x= 2 ,y= 1.0277 ,label= "***" ,size= 5 )+ annotate ("text" ,x= 3 ,y= 0.2774 ,label= "" ,size= 5 )+ annotate ("text" ,x= 4 ,y= 0.4163 ,label= "***" ,size= 5 )+ annotate ("text" ,x= 5 ,y= 1.009 ,label= "***" ,size= 5 )+ annotate ("text" ,x= 6 ,y= 1.0023 ,label= "***" ,size= 5 )+ annotate ("text" ,x= 7 ,y= 0.6262 ,label= "***" ,size= 5 )+ annotate ("text" ,x= 8 ,y= 0.3211 ,label= "**" ,size= 5 )+ annotate ("text" ,x= 9 ,y= 0.4783 ,label= "*" ,size= 5 )+ annotate ("text" ,x= 10 ,y= - 0.5592 ,label= "***" ,size= 5 )+ annotate ("text" ,x= 11 ,y= - 0.1092 ,label= "" ,size= 5 )+ annotate ("text" ,x= 12 ,y= 0.0744 ,label= "" ,size= 5 )+ annotate ("text" ,x= 13 ,y= 0.01 ,label= "" ,size= 5 )+ annotate ("text" ,x= 14 ,y= - 0.2795 ,label= "" ,size= 5 )+ annotate ("text" ,x= 15 ,y= - 0.2196 ,label= "*" ,size= 5 )+ annotate ("text" ,x= 16 ,y= - 0.1022 ,label= "" ,size= 5 )+ annotate ("text" ,x= 17 ,y= 0.0626 ,label= "" ,size= 5 )+ annotate ("text" ,x= 18 ,y= 0.155 ,label= "" ,size= 5 )+ annotate ("text" ,x= 19 ,y= - 0.206 ,label= "" ,size= 5 )+ annotate ("text" ,x= 20 ,y= 0.1922 ,label= "" ,size= 5 )+ annotate ("text" ,x= 21 ,y= - 0.8457 ,label= "**" ,size= 5 )+ annotate ("text" ,x= 22 ,y= 0.1504 ,label= "" ,size= 5 )+ annotate ("text" ,x= 23 ,y= - 0.1198 ,label= "" ,size= 5 )+ annotate ("text" ,x= 10.5 ,y= 1.54 ,label= "SMD" ,size= 5 , face = "bold" , colour= "black" )+ annotate ("text" ,x= 5 ,y= 1.49 ,label= "Management practices" ,size= 4 , face = "bold" , colour= "black" )+ annotate ("text" ,x= 16 ,y= 1.49 ,label= "Site factors" ,size= 4 , face = "bold" , colour= "black" )+ annotate ("text" ,x= 21 ,y= 1.4 ,label= expression (paste ("Pseudo-" ,italic (R^ 2 ),"= 0.63" )), size= 4 , face = "bold" , colour= "deeppink4" )
Warning in annotate("text", x = 10.5, y = 1.54, label = "SMD", size = 5, :
Ignoring unknown parameters: `face`
Warning in annotate("text", x = 5, y = 1.49, label = "Management practices", :
Ignoring unknown parameters: `face`
Warning in annotate("text", x = 16, y = 1.49, label = "Site factors", size = 4,
: Ignoring unknown parameters: `face`
Warning in annotate("text", x = 21, y = 1.4, label =
expression(paste("Pseudo-", : Ignoring unknown parameters: `face`
Warning in is.na(x): is.na() applied to non-(list or vector) of type
'expression'